Outcome-as-a-Service is the what: you buy the business result — diagnosed, built, deployed and measured. This page is the how — what actually happens, in what order, on what cadence, and who is accountable for the metric moving.
The mechanics below only make sense once you see what changes hands. With software, you take delivery of a tool and the outcome stays your problem. Under Outcome-as-a-Service, the outcome is ours.
An engagement isn't a project with an end date. It's a loop that runs — and each turn starts from a higher baseline than the last.
A half-day diagnostic finds the single binding business metric — with a current baseline and a target. Not "improve productivity," but a number: fuel cost per shipment, time-to-onboard, capacity utilisation. You leave with the Opportunity Map, Found Budget and Transformation Roadmap.
Forward-deployed experts and Xamun Intelligence design and build the system that moves the metric — spec-first via xDD, working software every 21 days. It launches instrumented to the metric, so Day 1 of operation produces measurable data.
The Objective Governance Dashboard tracks movement against the defined metric, weekly. What governance reveals — what's moving, what isn't, what to change — feeds straight back into Discovery and the next cycle.
↻ And again — at a higher baseline, every cycle. The metric you set in Discovery becomes the floor the next loop builds from.
"We'll work on it" isn't a contract. An OaaS engagement commits to three things, in writing, from the start.
The business metric is named in Discovery — a specific number with a current baseline and a target. The engagement is tied to that number, not to a deliverables list or a feature backlog.
Measurement is built at launch, not bolted on in v2. The moment the system goes live, it is already producing the data that proves whether the metric is moving.
The Objective Governance Dashboard tracks the metric weekly. If it isn't moving, Xamun Intelligence surfaces why and proposes the next adjustment — before the quarterly review, not after.
The metric is reviewed against baseline and target every week — continuous, not quarterly.
The system that moves the metric ships in 21-day increments. You own the code from Day 1.
We invest alongside you and are paid as the growth lands — our incentive is the metric.
Most transformations split the work across a strategy consultancy, an IT firm and a change team — and nobody owns the gap between them. Xamun runs the loop as one: forward-deployed experts who carry the result, Xamun Intelligence that guards the direction, and the Software Factory that builds it.
Senior Xamun people sit inside your operation and carry the number — 25+ years of building and running global software behind them. They set strategic direction, not just execution, and they don't hand the outcome off to anyone. Your success is their target.
Meet the people behind the loop →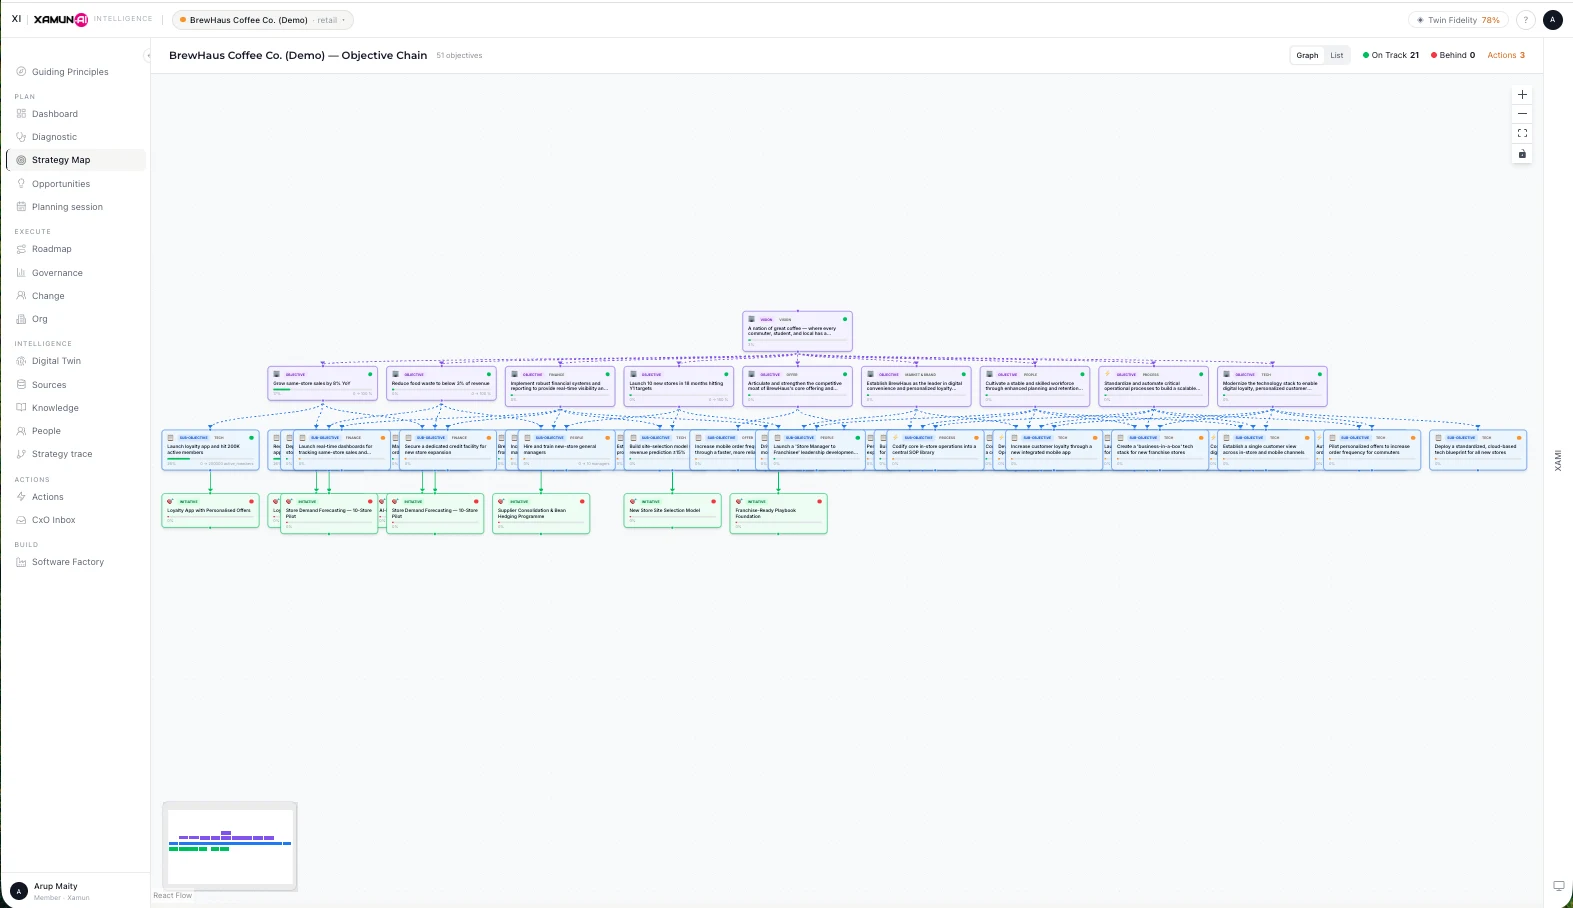
XI reads your operation continuously, derives what needs to be built to move the metric, and watches the result. When the number stalls, it surfaces why and proposes the next move — so governance is a nervous system, not a quarterly report.
Read more about Xamun Intelligence →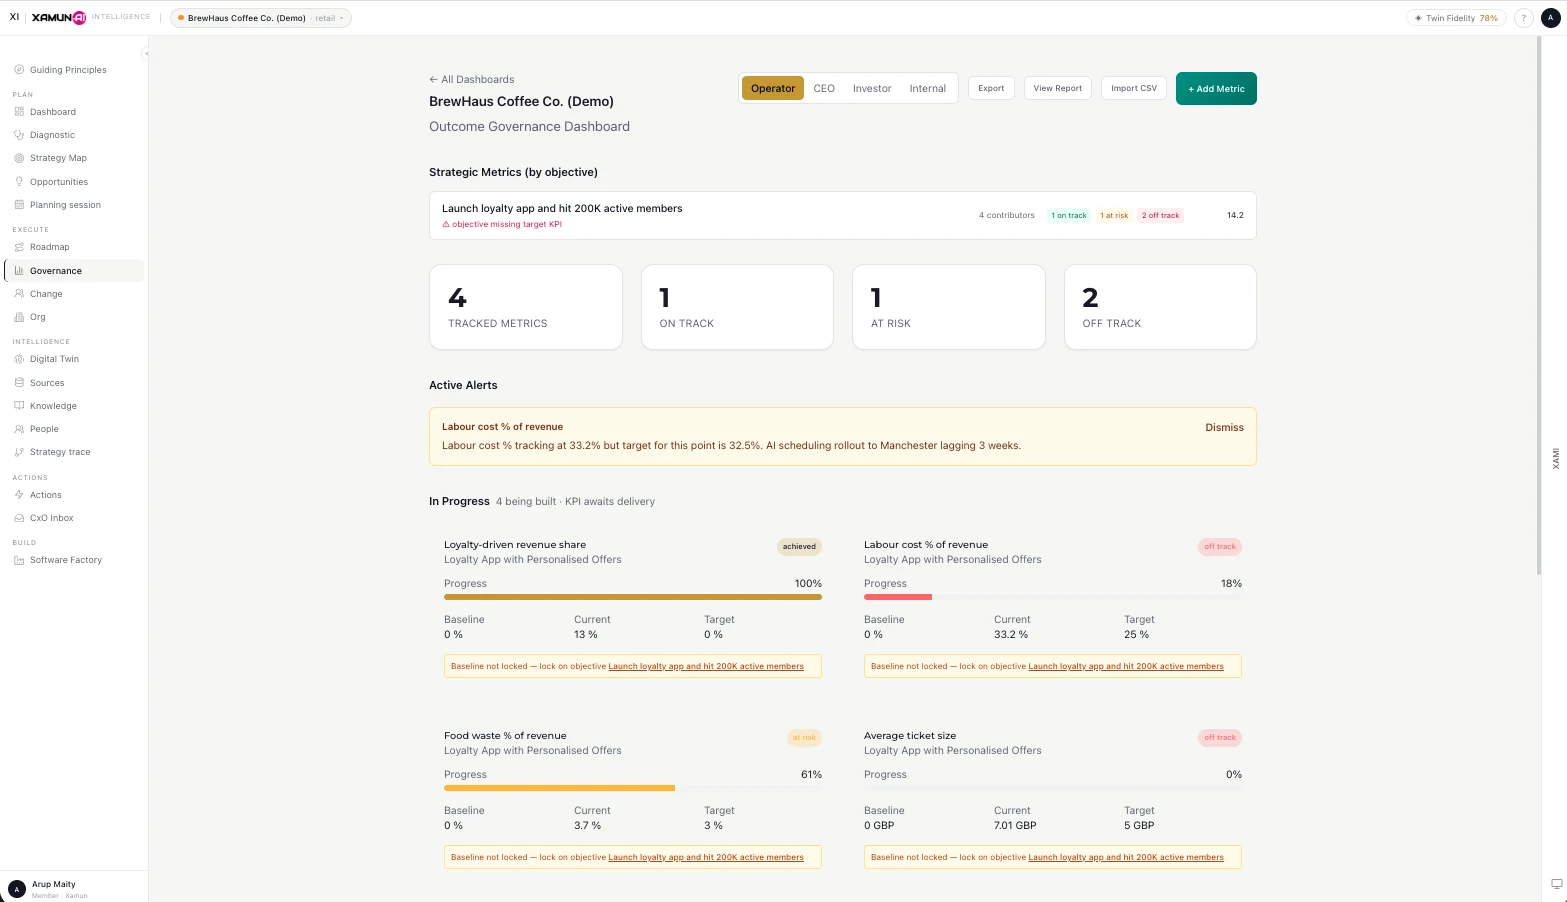
The Factory builds the system that moves the metric — spec-first via xDD, AI handling 70–80% of the build, expert engineers the rest, instrumented from launch. Coding tools make one developer faster. The Factory redesigns the whole lifecycle around AI and delivers the outcome, end to end.
Read more about the Software Factory →Velocity is vanity. Sprint completion, feature counts and a busy activity feed tell you the team was working — not whether the company moved. So those aren't what the Objective Governance Dashboard reports against.
What it reports is the one number named in Discovery, tracked weekly against its baseline and target. Fuel cost per shipment, down. Onboarding, from 8 days to 2 hours. Capacity utilisation, 65% to 82%. If the metric the CEO cared about isn't on the dashboard, the dashboard is theatre.
Same mechanics, different binding metric. Each is defined in Discovery and tracked from launch.
Illustrative of how the loop is scoped per sector. The binding metric and targets are set in your Discovery. See outcomes by industry →
A half-day Discovery names the binding metric and the fastest path to move it — with no upfront CAPEX. The Software Factory ships the system; the Governance Dashboard tracks the result.